We’ve all been there. Leads are down. Sales are falling behind. Customers are churning for no apparent reason. Brand awareness is not growing. What do you actually do when your numbers are falling behind? How to manage your team and help them get back on track?
How do you know if you’re falling behind?
First of all, it helps to be focused on the right things. For B2B SaaS Companies, the ultimate objective is to grow Annual Recurring Revenue (ARR) fast, often at T2D3 speed (tripling or doubling ARR annually). Later in the journey, SaaS Companies want to achieve this growth while also becoming profitable (also described as the “Rule of 40”, where annual growth rate and profitability add up to 40%).
For either goal, achieving T2D3 ARR growth or getting to “Rule of 40” profitability, it’s key to understand that the main drivers are the following.
ARR Growth Drivers
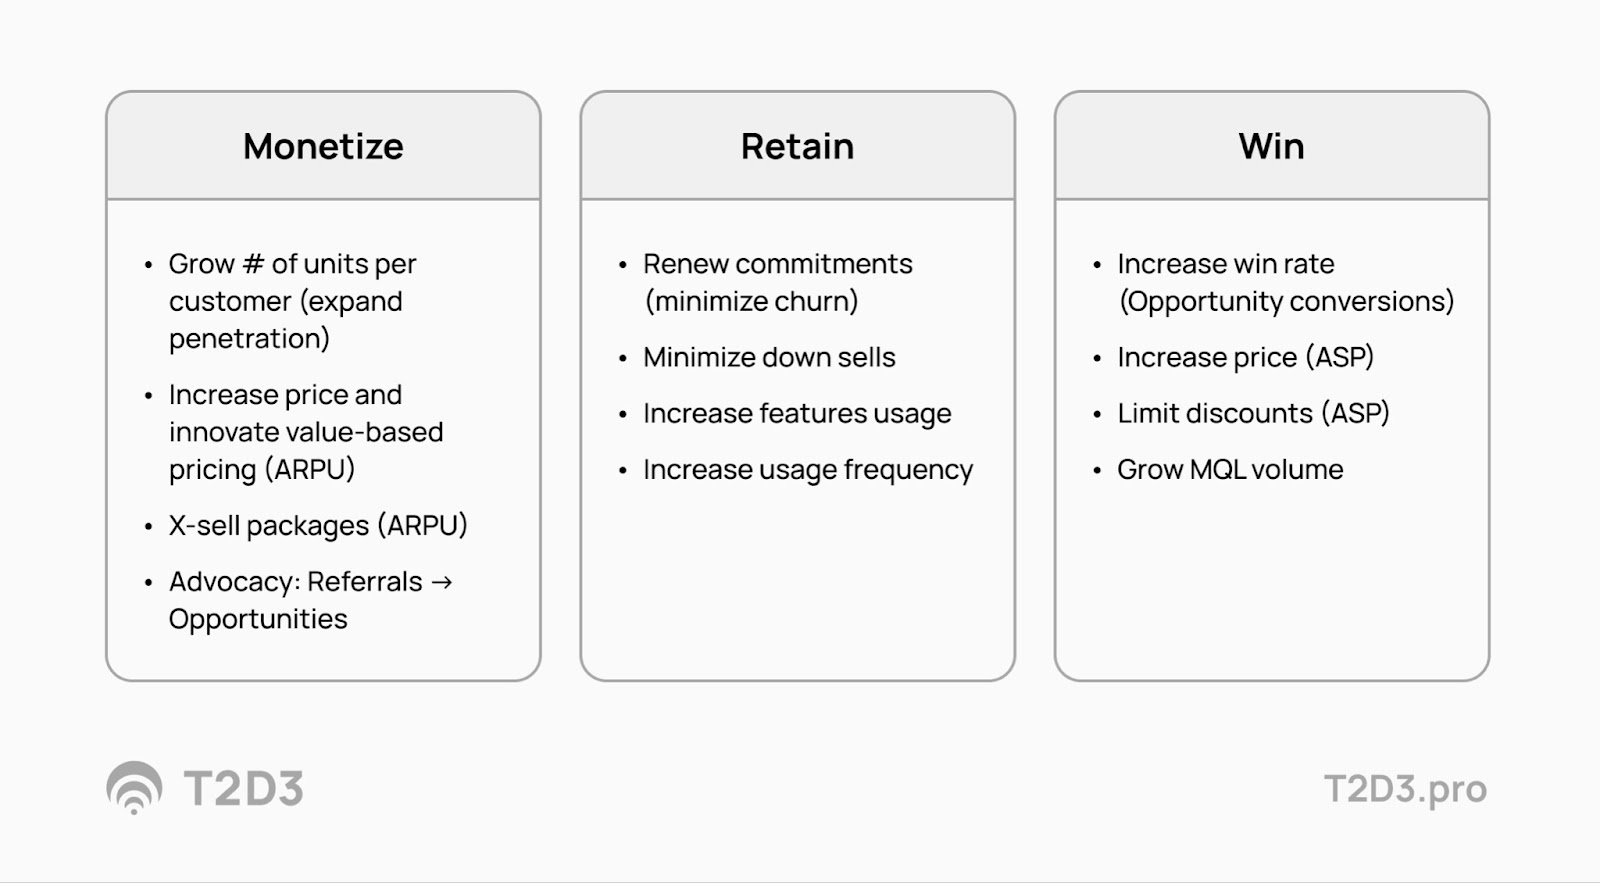
The above box sizes are meant to communicate the relative impact on ARR of the three different focus areas. While it’s natural for many (especially recently funded) B2B SaaS Companies to focus on “new pipeline” and awareness and demand generation, the biggest drivers of ARR are to get more from your existing customers and to make sure they stay. Heck, most SaaS Companies got to where they are when getting funded by doing just the boxes on the left.
- Monetize
- Grow # of Units per Customer Logo (i.e., expand user penetration).
- Increase ARPU (price optimization, X-sell).
- Drive advocacy: Turn referrals into new opportunities.
- Retain
- Renew customer commitments (minimize churn).
- Minimize down-sells by existing customers.
- Increase features usage and/or usage frequency by existing users.
- Win
- Increase win rate (Opportunity conversions to Customers).
- Drive the Average Sales Price (ASP) through upsell and limiting discounts.
- Grow MQL Volume. Increase the size of the funnel.
I’m using a lot of terms and acronyms here. I’ve explained them at the bottom of this article.
Managing performance and execution
To use dashboards, reports, and team meetings effectively to track and optimize results and learn together as a team, I believe there are four distinct periods to consider. Weekly, Monthly, Quarterly, and Annually. Here’s how I optimize performance management at each point:
Annually
Once every year, most companies submit their financial plan (budget) to their board for approval. This is grounded in the Company Strategy and includes ARR growth, budget to pay people, and pay for non-people expenses (OPEX). It usually also includes the bookings that are needed to come in to achieve the ARR targets and, of course, profitability, EBITDA, or something along those lines.
As a Go-to-Market leader, leading a marketing, sales, customer success, or all-up revenue function, you also need to have in place the Ideal Customer Profile (ICP) you are targeting as a company (“Who’s it for?”), how you position yourself (Positioning, “What’s it for?”) and a broad stroke idea of the core growth levers that will help you achieve your growth objectives (i.e., entering a certain part of the market, increasing the ARR per customer by launching a specific product, more examples here). If you plan to structurally change your packaging and/or pricing, your Go-to-Market strategy (Product led growth vs. Sales led growth), these would also be things to plan for on an annual basis (here is an article about creating your company GTM Strategy).
A dedicated “planning offsite” with your leadership team is often the best vehicle to get most of these plans in place, and then each function can turn those into the appropriate plan for their teams. I like to use this growth planning matrix exercise to facilitate these discussions.
Quarterly
A quarter of 13 weeks is ideal for adjusting tactical priorities to support the company's strategy. Many SaaS businesses use a so-called QBR (Quarterly Business Review) to review the performance vs. plan of the previous quarter and distill lessons learned that form the foundation for the priorities of the next quarter. I love to use OKRs (Objectives and Key Results) to turn these quarterly priorities into actionable goals and measurable outcomes for each team member. Here you can find an introduction, process, and template to use OKRs. Finally, the quarterly rhythm includes presenting to the Board of Directors for most companies.
Considerations for your Quarterly Rhythm:
- Review and adjust Tactical Priorities to deliver the annual plan
- Provide input for your team members' Objectives & Key Results
- Implement Seasonal adjustments based on your industry and market
- Prepare your quarterly Board Meeting Materials
- KPI focus: ARR at the right cost (Rule of 40%, EBITDA, CAC/CTS)
Consider running a QBR to be the foundation for these quarterly focus areas.
Monthly
While the quarter is good to set priorities and align those with company strategy, it would take too long to wait for that and address real issues with performance, learn that certain campaigns are not working, or double down on an initiative that seems to be very successful.
A monthly leadership meeting with all the ARR influencing leaders (marketing, sales, customer success, and sometimes product) is a great opportunity to reflect on a month's execution and learn from that. This meeting is where you spend a couple of hours discussing any new insights, challenges, and what to do with those.
Considerations for your Monthly Rhythm:
- Looking back and learning from a month of execution.
- Funnel Quality deep-dive
- Funnel Speed deep-dive
- Use integrated RevOps Analysis of data to support more Insights
- Turn Insights → Actions
- Update Financial Forecast
- Consider Structural improvements that cannot be addressed in the weekly meeting
- KPI focus: Bookings (new and expansion), pipeline growth in various funnel stages (leads, deal sizes) and renewals.
Weekly
The monthly meeting is more about looking back and making adjustments based on what was learned; the weekly meeting is more forward-looking at the week ahead.
Considerations for your Weekly Rhythm:
- Focus on Lead flow, Bookings expected this and next week & Churn risks.
- Provide a “safe” locker room environment for supporting each other short-term
- Forward-looking, closing a strong week ahead.
- Update Sales Forecast as appropriate
- 1:1 check-ins to complement the team meeting. Good to use OKRs for that as well.
- KPI focus: Weekly Bowler
SaaS Growth is a team sport
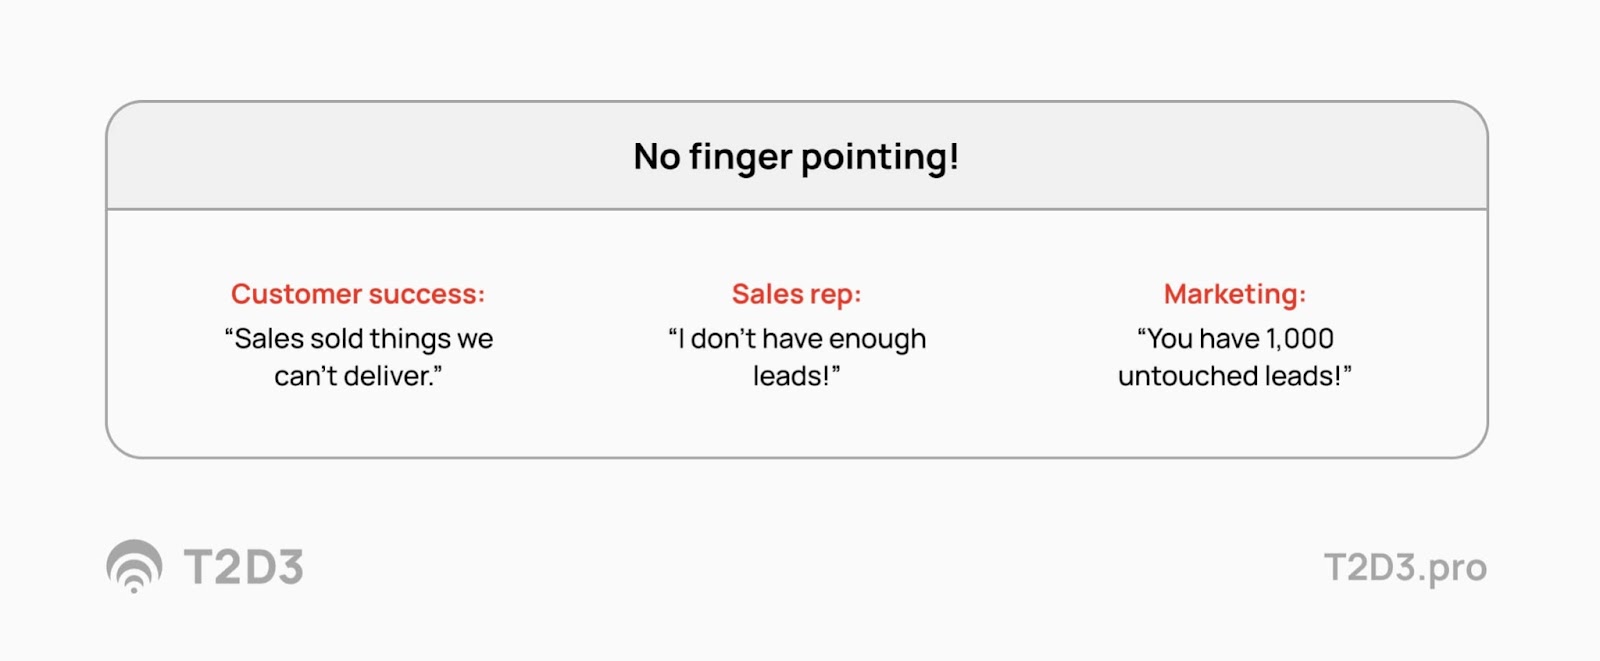
In each of these meetings, be it annually or weekly, it’s essential to realize that SaaS success and delivering ARR growth at the right cost have to be done together across marketing, sales, customer success, product and all other teams in the company. If, at any point, these functions start to point fingers at each other, you have a structural problem that needs to be addressed.
In a high-growth environment, every team can usually improve what they do. While you want healthy communication and sometimes appropriate escalation between functions, every team needs to start with what they can control themselves. OKRs can be a great tool for inter-team alignment on priorities and dependencies. Incentives also need to be aligned. For example, I like a model where Customer Success has a small part of their variable pay be connected to landing new business, and Sales Executives get paid for part of the renewal and expansion after landing the initial deal.
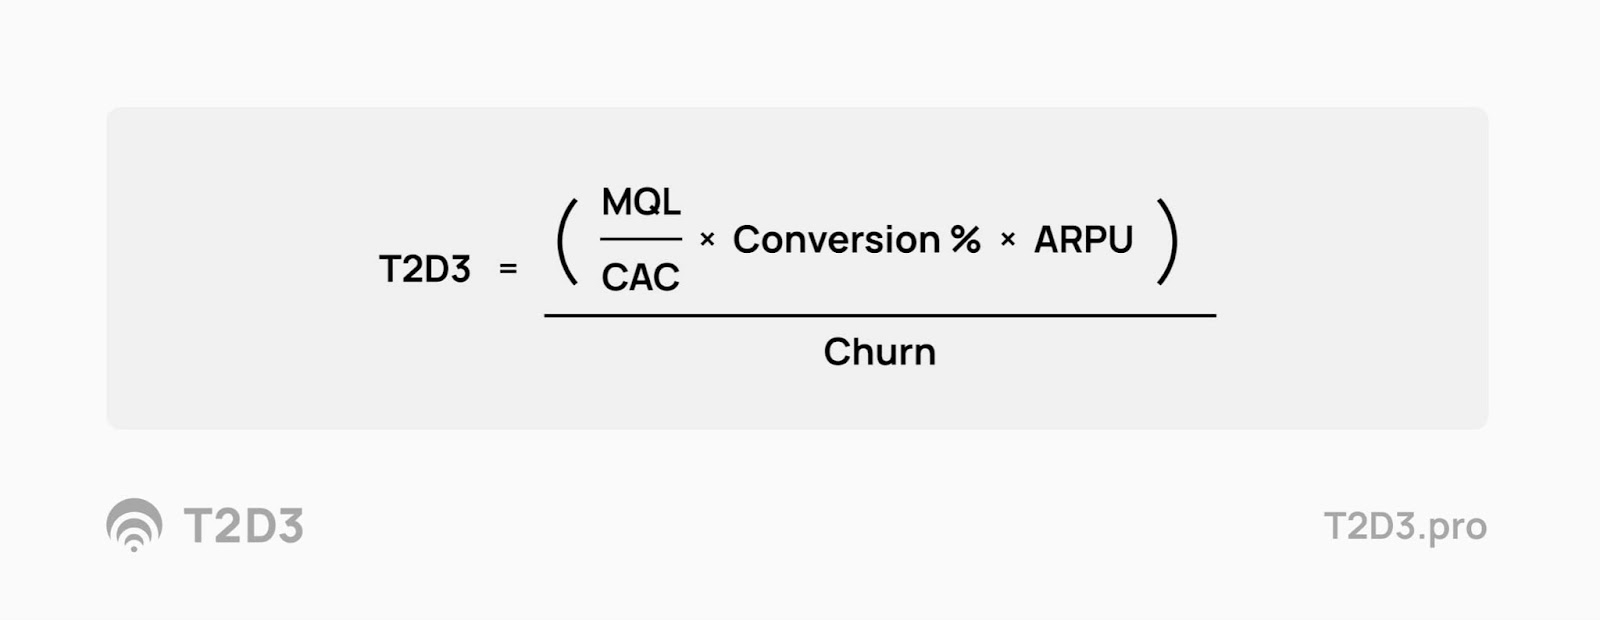
In the end, as the below formula tries to illustrate, exponential ARR growth at healthy ROI levels will be a combination of many factors.
Let me dive deeper into how you can run each of these meetings and what tools to use.
How to run a weekly GTM Team meeting?
The weekly meeting focuses on what’s right in front of you. What needs to be addressed this week, today, or tomorrow? Ideally, this meeting happens on Monday, or latest on Tuesday, so the impact can be realized in the same week.
What to focus on?
Coach your team not to spend time repeating information that was already discussed the week before or just sharing information. Even if there is progress to report, try to limit that to areas where help is needed or the progress is critical for others to know about.
It’s important for this meeting to be a relatively “safe” environment where the team can share factual challenges, needs, and concerns, without being judged. Of course, everyone in the team is expected to think about the next steps and what to do about a certain challenge, vs. just “reporting the news”. After hearing about a challenge or a need, this meeting addresses what we can do about it in the next couple of days.
Here is a list of focus areas to help you run the weekly meeting:
- Unblocking - Focus first on things that have gotten stuck. These things cannot wait and must be surfaced and addressed in your weekly meeting. A couple of examples are:
- A salesperson waiting for an answer about a product capability
- A meeting that’s not being scheduled because someone is out of the office
- A lead that is not being followed up because it’s unclear who the owner is.
- On hold - What items are in a “holding pattern”? For example:
- Is a salesperson unsure how to prepare a proposal and needs help?
- Do you have a recently hired SDR who has not been trained on your CRM correctly and thus is “on pause” without daring to ask for help?
- The sales desk is sitting on a renewal invoice as they think there is a support ticket that they need to wait for, but the ticket was actually closed.
- Your marketing team is postponing an event because they incorrectly assume there is no budget for it right now, vs. escalating and trying to repurpose another budget.
- Support - Ensure to nurture a culture where your team can and will ask for help from others, ideally before the problem gets too big. I’ve seen support asks be postponed too long while it was clear earlier that some executive engagement, or a special resource who can do a specific demo, was the right thing to do earlier. So, in short, encourage your team to always ask for help, even if they are not sure if they need it now, maybe in the near future, or not at all. This helps the rest of the team to plan ahead and help decide what to do next.
- Start - Any events or campaigns that are about to start are worth mentioning in the weekly meeting. This usually includes marketing updates, price changes, feature releases, or for example, systems maintenance.
- Critical - Are any deals (opportunities), renewals, new leads, or events so noteworthy that they need to be mentioned? This is the time to make sure everyone has a line of sight. There is a fantastic book, Team of Teams, that talks about how our organizations have become so interconnected across teams and even external parties that over-communication is often very useful to keep everyone on the same page.
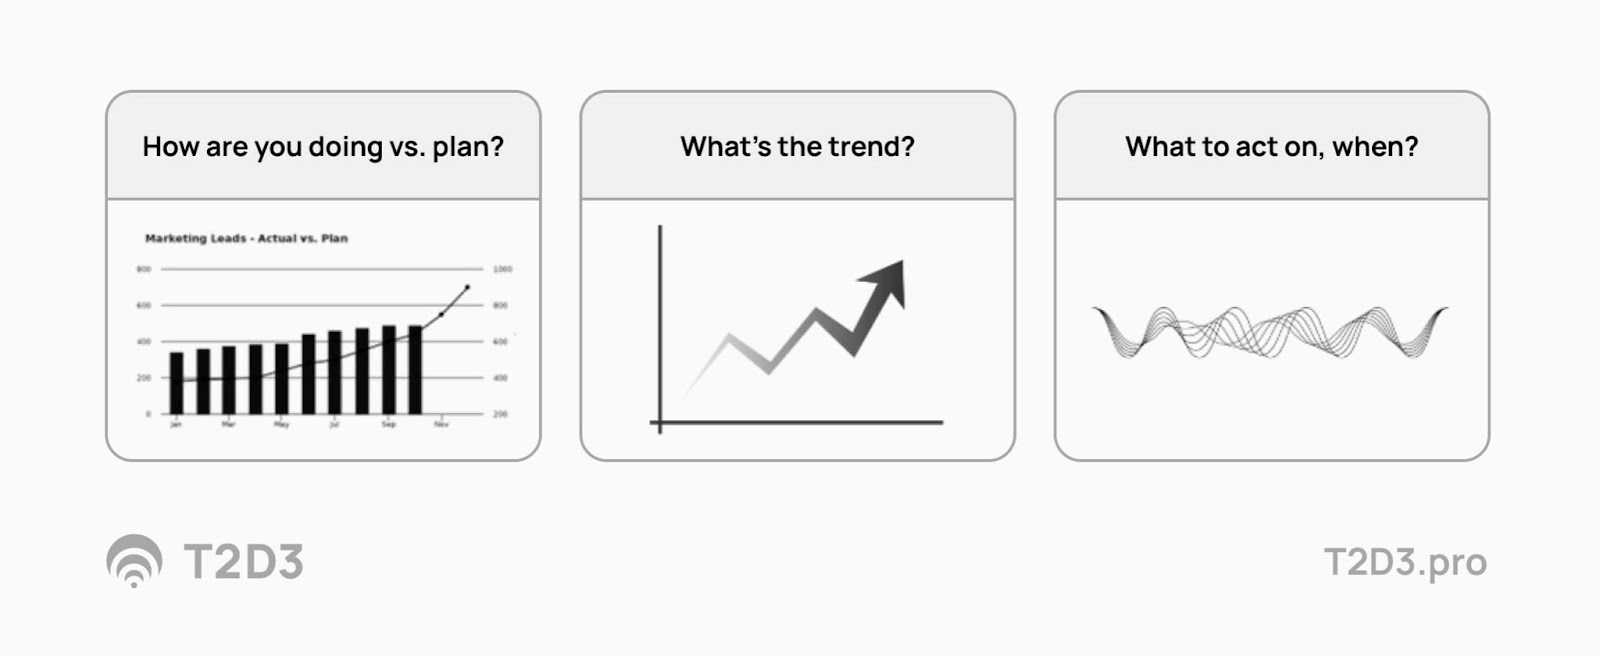
I love to use a so-called bowler chart to track the performance of the most critical KPIs in a SaaS business weekly. This frequency helps make things actionable and reduces the complexity of understanding what’s happening, the trends, where we are falling behind, and where to focus the conversation. The fact that every week is exactly 7 days also makes comparing trends easier vs., for example, a monthly chart with varying lengths of months.
Bowlers have their roots in Japanese business management theory, like Hoshin Kanri - Wikipedia, and I’ve adopted some of these to be appropriate to use in a fast-changing, high-scale B2B SaaS company environment.
The Bowler, or Bowling Chart, resembles the scorecard used in bowling. Hence its name. The chart helps track the performance vs. plan of the KPIs that your team is accountable for. The rows contain the weekly targets and actual results, usually for the period of a year. Each KPI (or Key Result, if you map this to OKRs, something I recommend considering) will be one row.
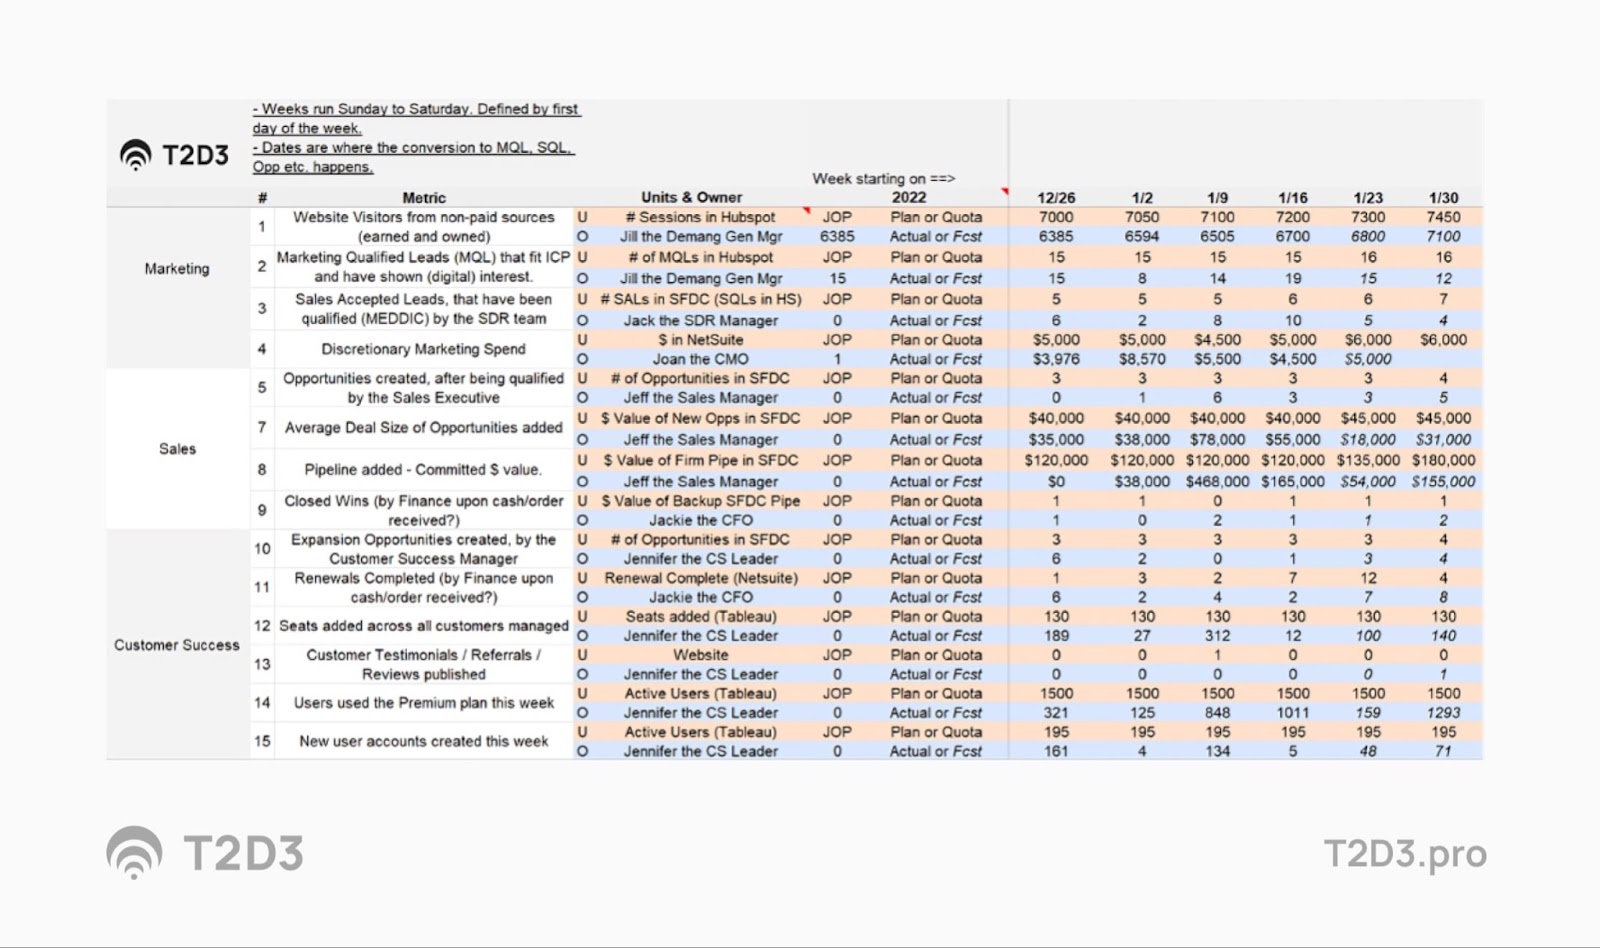
You can get as fancy as you like with the bowler, and for example, add red and green colors for missing or making a target in a given week. You can add sparklines to show trends and ask your team to fill out forecast numbers in the actual results row for the future (using the italic font, for example).
The Bowler chart helps you in your weekly meeting to uncover immediate areas of attention, using a simple set of metrics that show marketing, sales, and customer success funnels. Lead flow, opportunity development, customer onboarding, and renewals are just a couple of examples of critical parts of how you track success that can support your weekly meetings.
Finally, the bowler is very useful in quickly distinguishing trends that can be considered signal vs. noise and showing if a metric that is falling behind the plan is trending up or down, providing good insight as to what to do next and wetter to even spend time on it.
How to run a monthly GTM Leadership meeting?
In the monthly meeting, it’s time to look back. While in the weekly meeting, you will see trends and notice structural issues or best practices; you are so focused on the here and now that you’ll not have much time to deal with it. In the monthly meeting, it’s time to address this.
Key Insights
These are some things to get on the table in the monthly meeting:
- Performance vs. plan - How are we performing vs. our original plan, including the assumptions we made and new circumstances we encountered?
- Trends - Are any of our KPIs, or other metrics, showing a specific trend? Is this something to be excited or concerned about?
- Outliers - Make sure we understand what metrics or trends are worth taking a deeper look at. Some might be anomalies that are easy to explain and not worth spending calories on. What’s the signal vs. noise?
- Market and competition - What are we learning about our external environment? What have we heard from customers and partners? What’s happening with our competitors? The monthly meeting is a good time to discuss these insights.
The 80/20 rule
A great instrument to focus the energy on the right opportunities in your monthly meeting are the so-called “Pareto charts.”
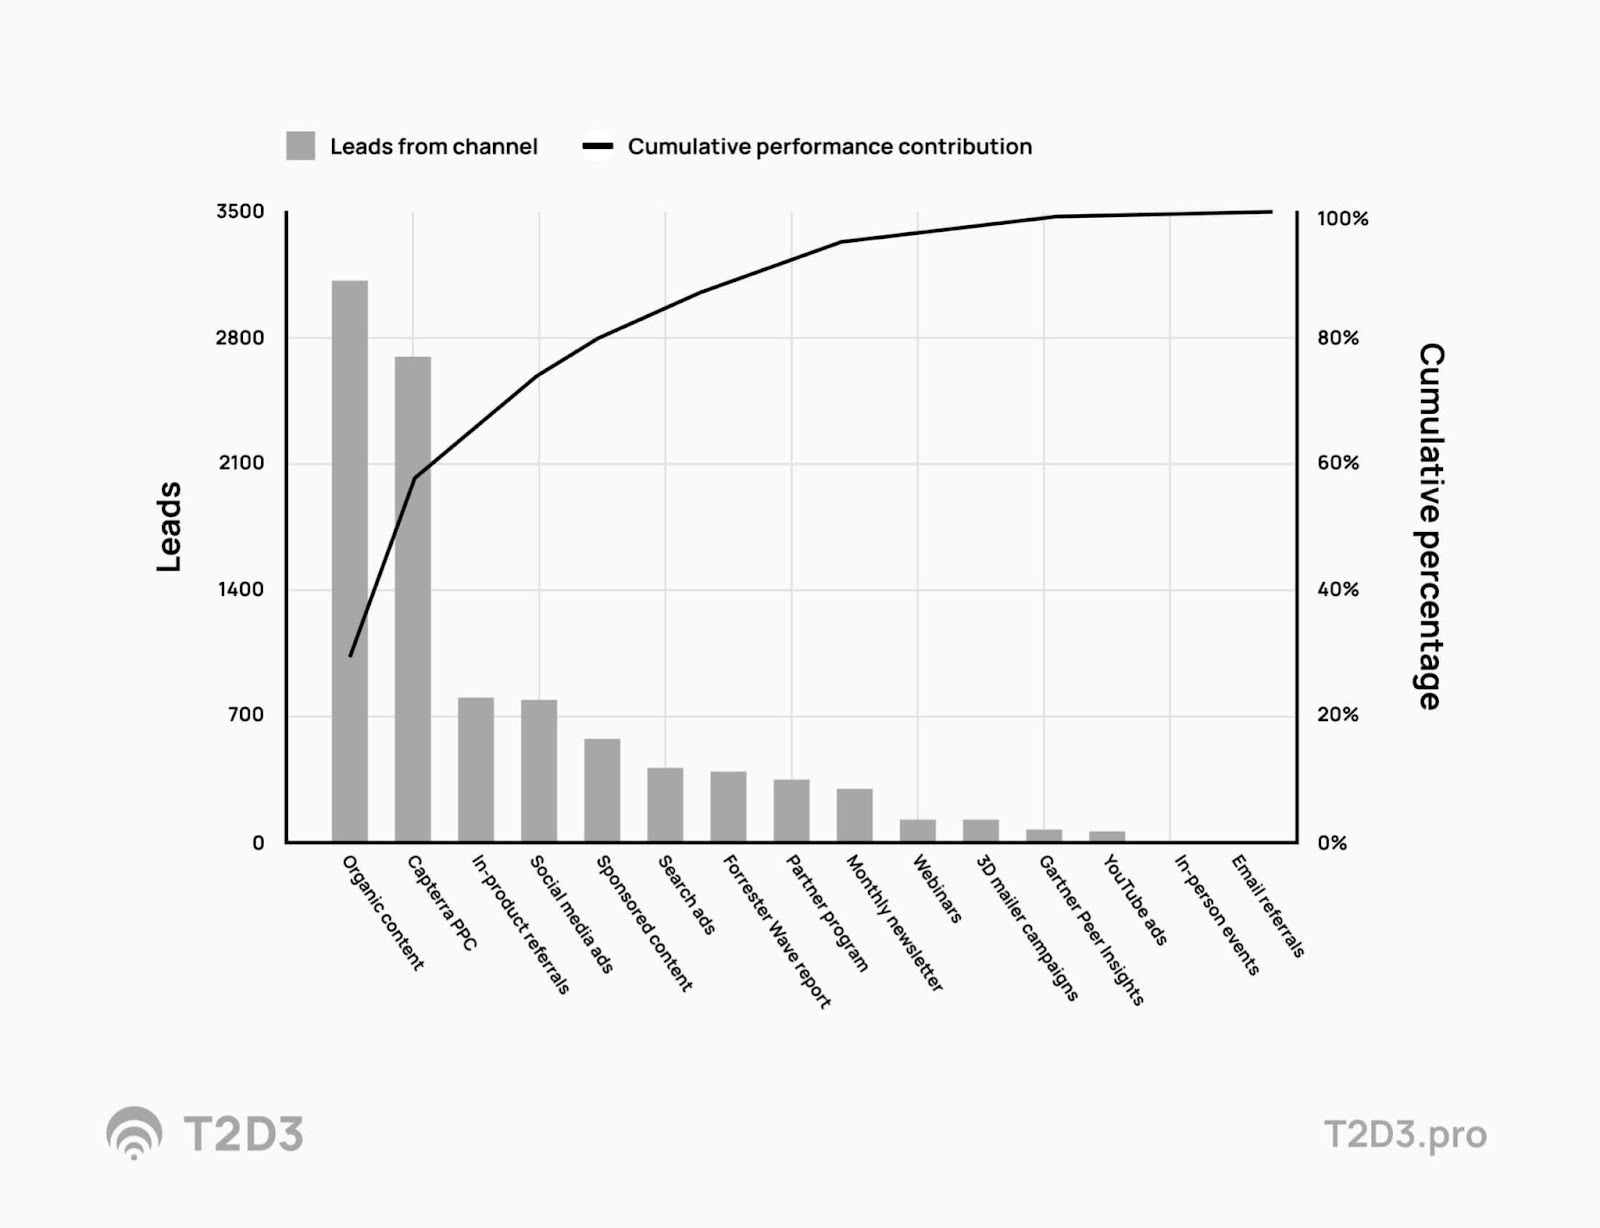
It’s amazing how in every business, you will find a version of this. I’ll step out on a limb and state that I strongly believe a Go-to-market leadership team for a fast-growing B2B SaaS Company should only focus their energy on insights that follow the Pareto principle, where they can impact 80% of results by addressing 20% of the underlining actions, team, time-usage or other forms of resource investment.
Areas to focus on
Topics to inspect, discuss and consider improving on are for example
- Performance vs. Plan for all the key performance targets.
- Analyze the funnel performance
- Speed and friction
- Conversions and hand-off points
- Analyze specific Channel- and Campaign performance
- Dive deep into ACV/ASP and Discounting trends as needed
- Analyse “cost/” for various funnel stages (cost per lead, cost per click, cost per opportunity, Customer Acquisition Cost etc.)
- Consider updating the Financial Forecast together with Finance.
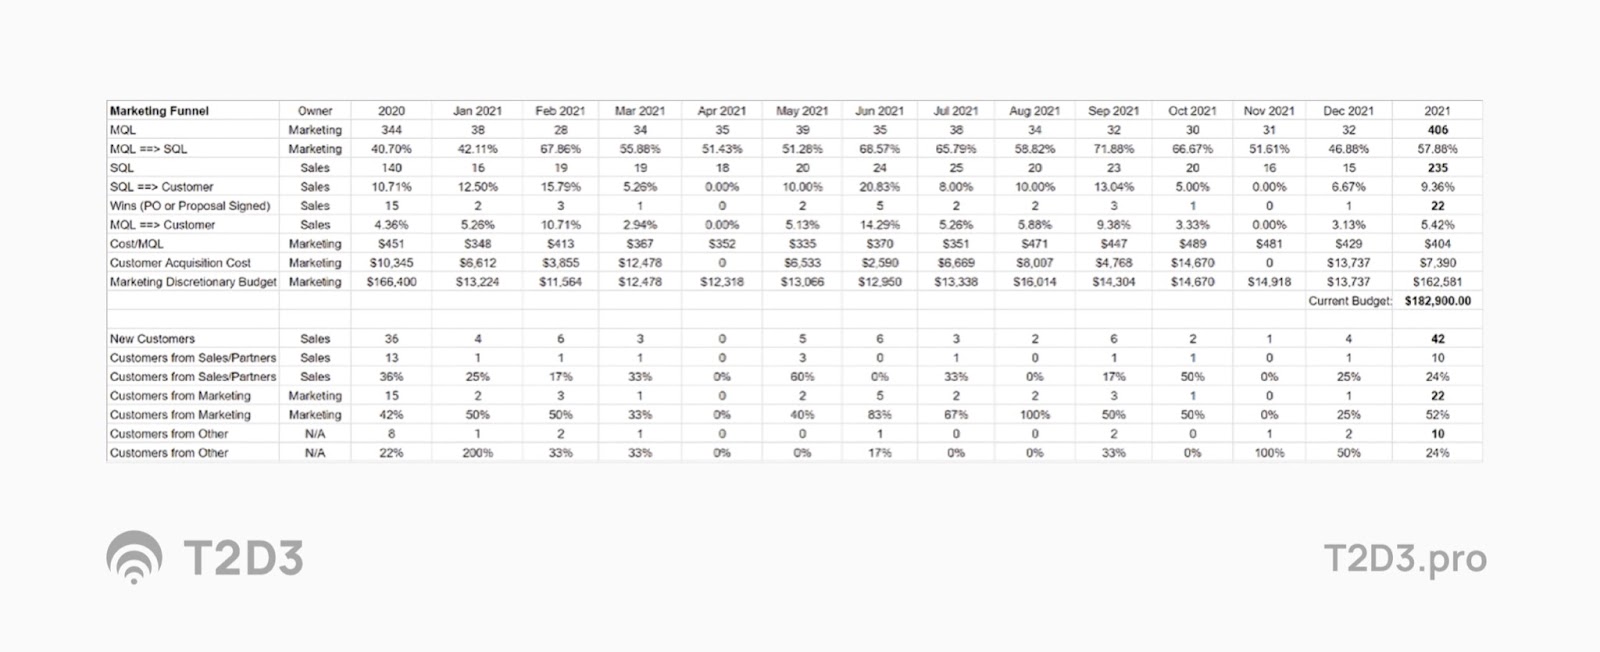
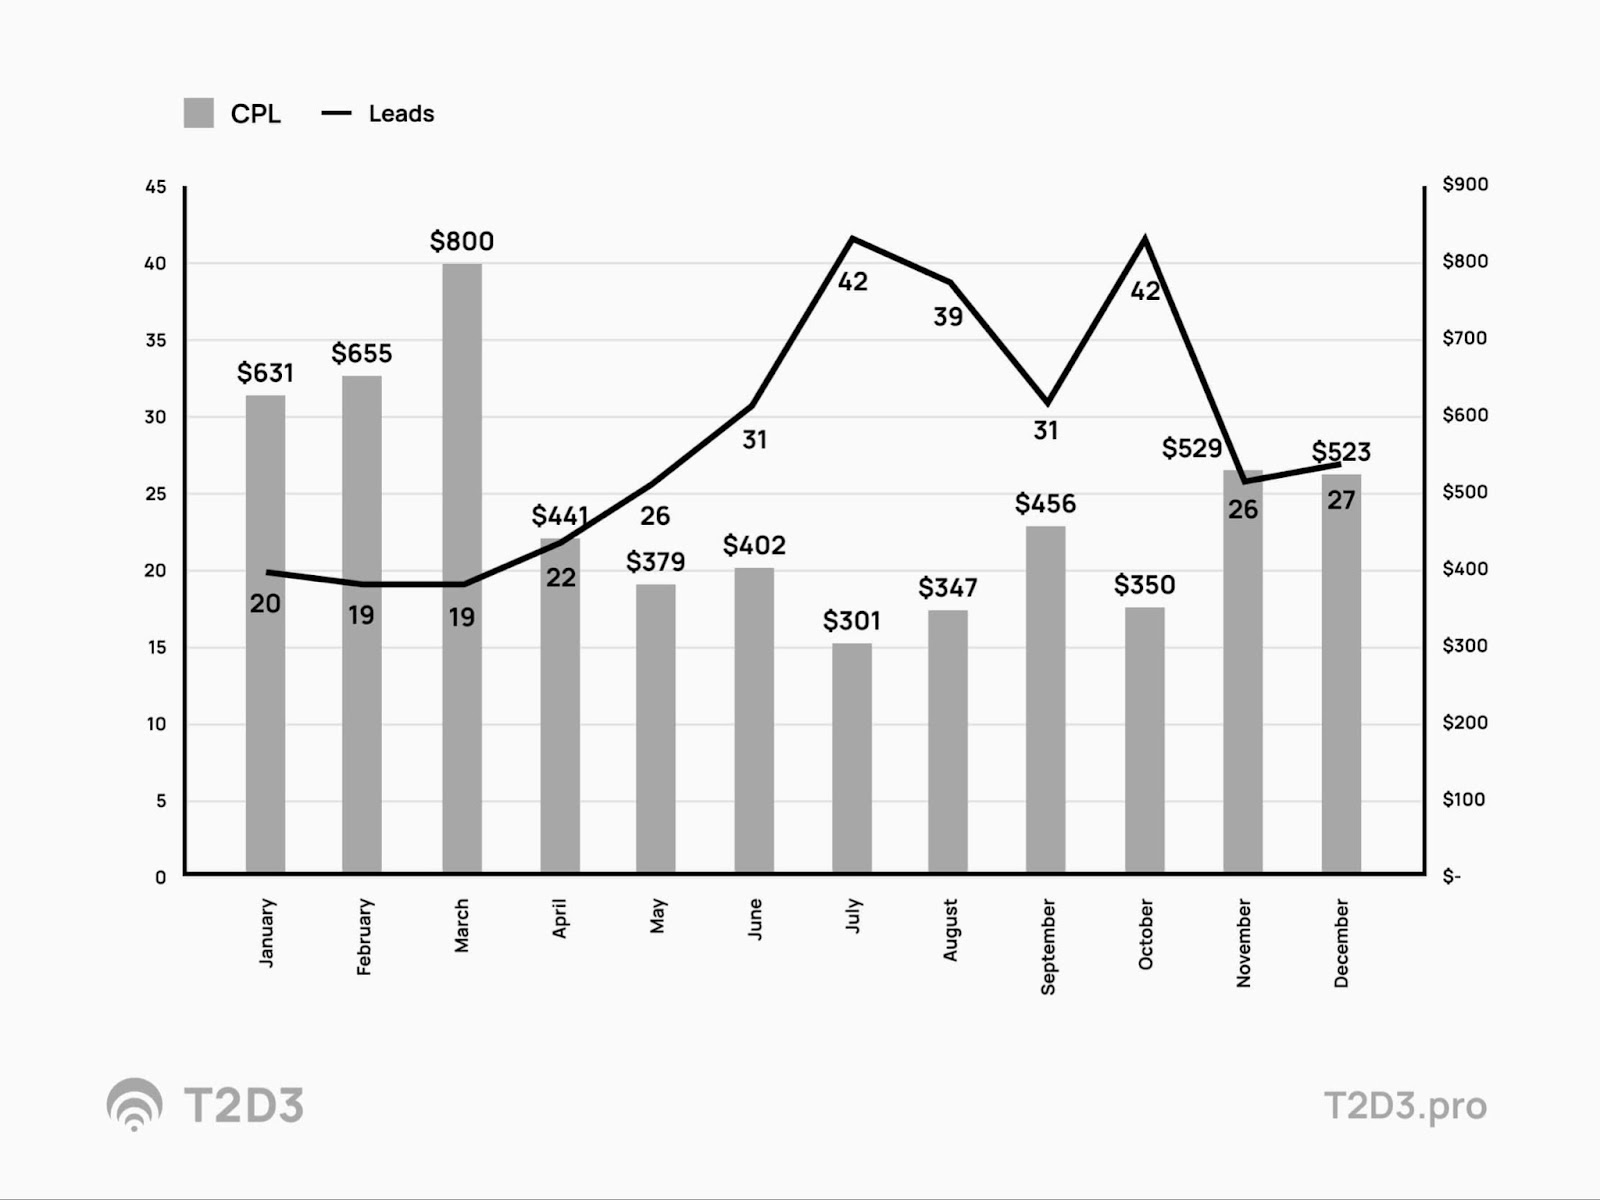
Using the weekly bowler data, you can combine that into a monthly view that adds some of the “cost per” and funnel speed/conversion calculations, like in the below example:
Here are a couple more examples and what questions you could ask next:
|
Pareto observation
|
Follow-up question examples
|
|
80% of our bookings are generated by 20% of the sales team members
|
- What is it they do that others can learn from? How can me hire more like them?
- Is there something about the type of prospects/market they focus on that is special?
|
|
Organic leads are dropping
|
- Who is winning the search positions that we used to win? What is their content doing that is beating us in the eyes of Google?
- Do we have a clear set of top 5 priority KW we are focused on? Do we know exactly why our audience searches for those and how we can create better content than anyone else competing for the audience that we are supposed to be able to service best?
- Is our technical (on-page) SEO top-notch? Is our audit “score” in Semrush 90 or higher? How do we get there?
- Do we understand the core questions of our key personas as they travel along their buyers' journey? Do we have great lead magnets and supporting content for each stage (awareness, consideration, conversion) to help them along the journey?
|
|
Demand generation is not meeting the targets
|
- What part of our marketing team is laser-focused on their work generating MQLs?
- From content to social, events, product marketing, and paid campaigns, have we optimized everything to lead to MQL outcomes?
|
|
The conversion of MQLs to SQLs is not meeting our expectations.
|
- What’s the time between a prospect raising their hand and us getting back to them?
- When we “mystery shop” the process, are all nurture communications and follow-up steps as easy and low friction as possible?
- Is the SDR team able to schedule enough meetings fast enough? Do we have enough capacity to have calendar availability in the right time zones?
- Is our SDR team trained well enough to do great qualification calls? Do they have the right materials?
|
|
SQLs are not converting to Opportunities as expected
|
- Is our sales team following up fast enough? Do we have the right hand-off process and enough capacity to do so?
- Is the sales team trained and equipped with the right materials to turn SQLs into solid opportunity qualifications?
- Analyzing the last 10 SQLs that did not convert into opportunities, what was the delta between the opportunity qualification criteria that were not met, and the SDR qualification being met to make it an SQL?
|
|
The campaign we launched is not producing the expected amount of leads.
|
- What’s the ICP we are focused on? Are the Personas clear, including their pain points and what they stand to gain from working with us?
- Is our content written to connect with the audience and with their pain and map it to our claims (do we have a good offer? A good CTA? Lead Magnet?)
- Is the channel we are using for the communications working as expected? What do we know about the timing, the type of digital execution, and what is different vs. our original assumptions?
|
|
Opportunities don’t close. We’ve send proposals, done the demo, and prospects just kick the can down the road.
|
- Is our value proposition clearly defining value that can be attained now?
- Are we talking with the decision maker who cares about that value?
- Have we provided our advocates with all the best tools we can give them to get alignment internally in their organization?
- Is the problem we are solving for them as big as we think it is?
|
|
Renewals are slipping behind the renewal date
|
- When do we communicate the renewal to our prospects?
- Do they understand what they stand to lose if they don’t renew?
- Is it clear what value our solutions have delivered for them lately?
|
Key Actions
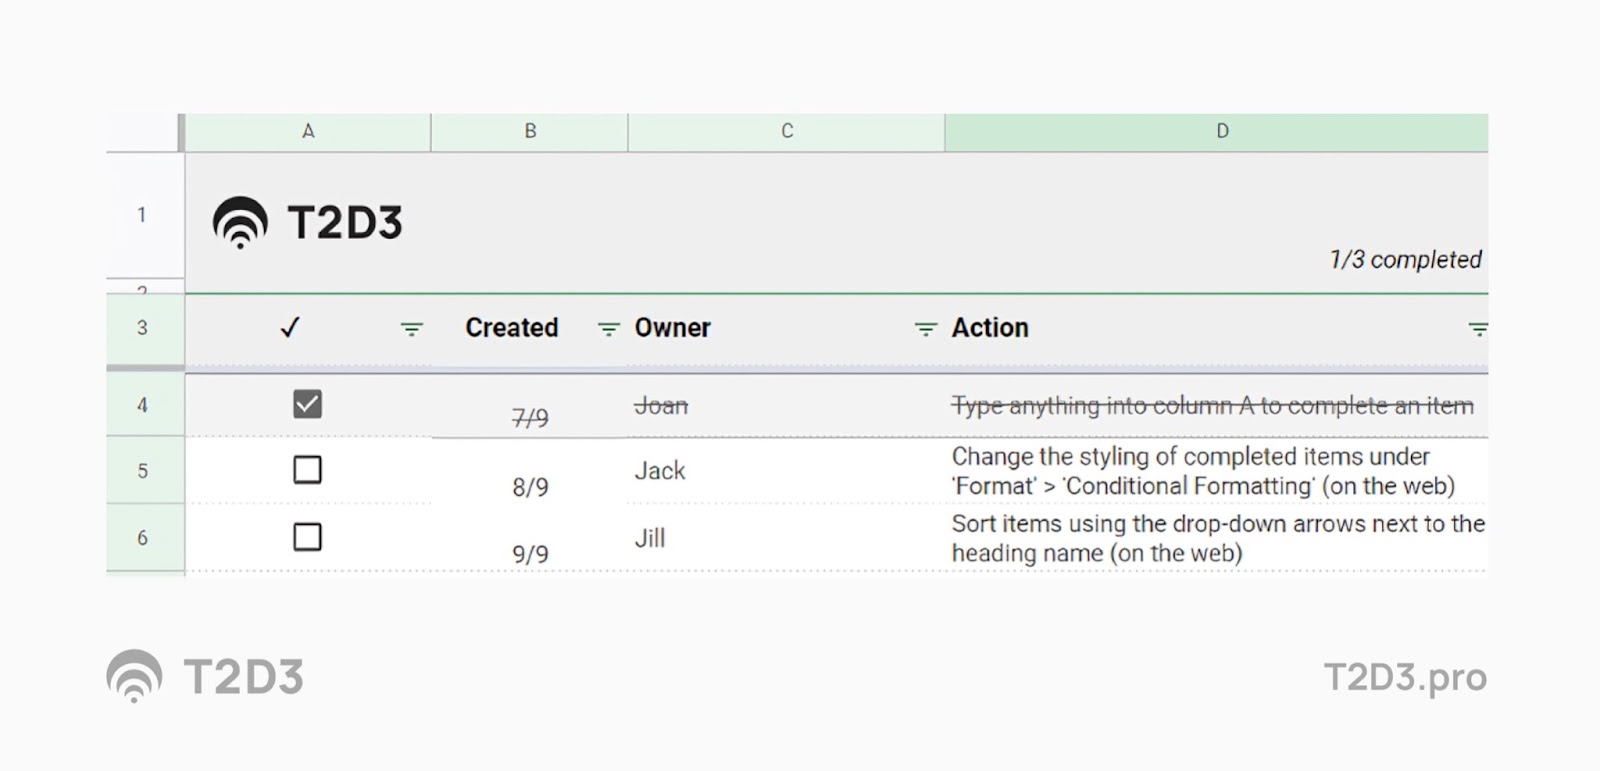
Applying the Pareto principle to all the things you can act on, I recommend you pick a few and then really focus on those. Based on the insights, you must leave the monthly meeting with clear actions, owners, and next steps. While we all know this is critical, many teams struggle with solid follow-up and follow-through. There are many tools you can use to do this. I recommend keeping it simple, though; an action plan tracker like this is simple and removes any excuse of not tracking these after a meeting.
The following “categories” could warrant specific actions based on your insights and learnings:
- Process - Do we need to make any changes to the way we do things? This could be a lead hand-off process or the way we manage events. How we train our salespeople, or how we do health checks from Customer Success. Can we improve the renewal process and make it more automated? Where can we improve efficiency or effectiveness, or both?
- ROI - What should we stop? Or at least inspect more? Where should we double down and invest more? What test should we run to confirm a suspicion and turn it into a conclusion?
- People - Who’s hitting it out of the park? Can this person be supported to have even more impact? Can she take on more important work? Who’s falling behind? Do they have clear OKRs? What type of coaching does he need? And most importantly, what action will someone take to address this?
- Forecast - Should we update our financial forecast? While the Board of Directors usually only needs this quarterly, it’s a good practice to use your Monthly meeting to check in on how your ongoing insights can be made concrete with a Financial Forecast.
- Strategy - While I like to keep the strategy stable for at least a quarter (using OKRs), there is an old Dakota tribal wisdom that basically says, “When you are riding on a dead horse, it’s time to get off”. So while I don’t recommend introducing new strategic priorities monthly, you should also not keep doing things that clearly don’t work.
What to do when you’re falling behind?
Another “borrow” from the Japanese business management theory, Hoshin Kanri is so-called A3 Problem Solving (from back in the day when this was done on an A3 format paper on the factory floor).
The approach warrants that a team focuses on the right root cause of a problem rather than a symptom and ensures clear actions and follow-up. The below is an example of what the A3 format template would look like.
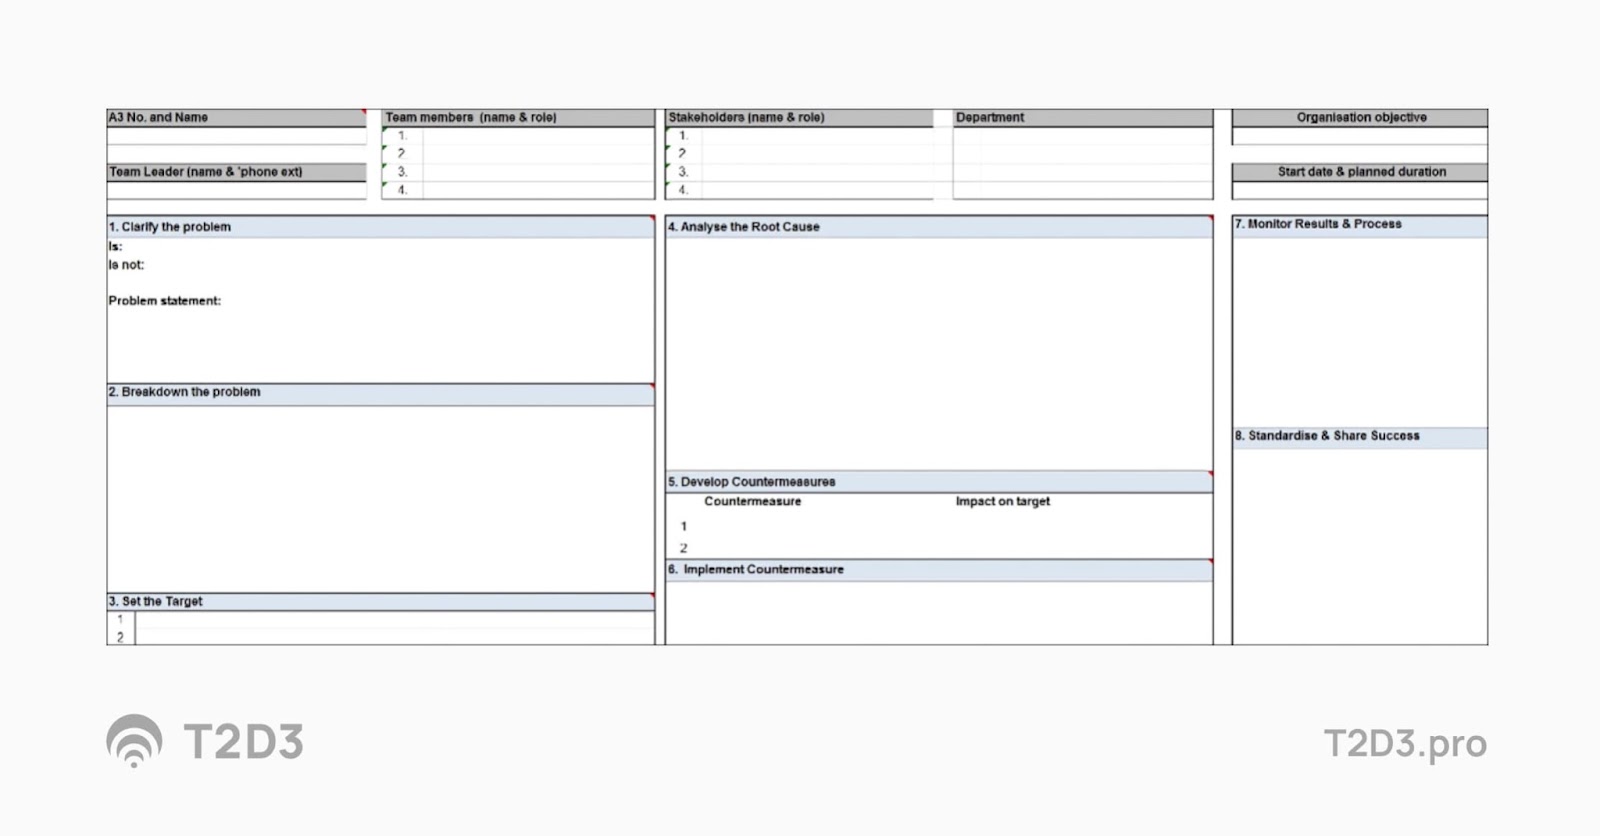
There are many other examples online.
After confirming the problem is the right problem to solve, it’s well understood, worth solving (agree on the target, and is still valid), a critical next step of problem-solving is breaking down the problem into possible solutions and actionable next steps. The Key is to first find the root cause (our multiple causes) that can be addressed. A common way of doing this is using a Ishikawa (or fishbone) diagram.
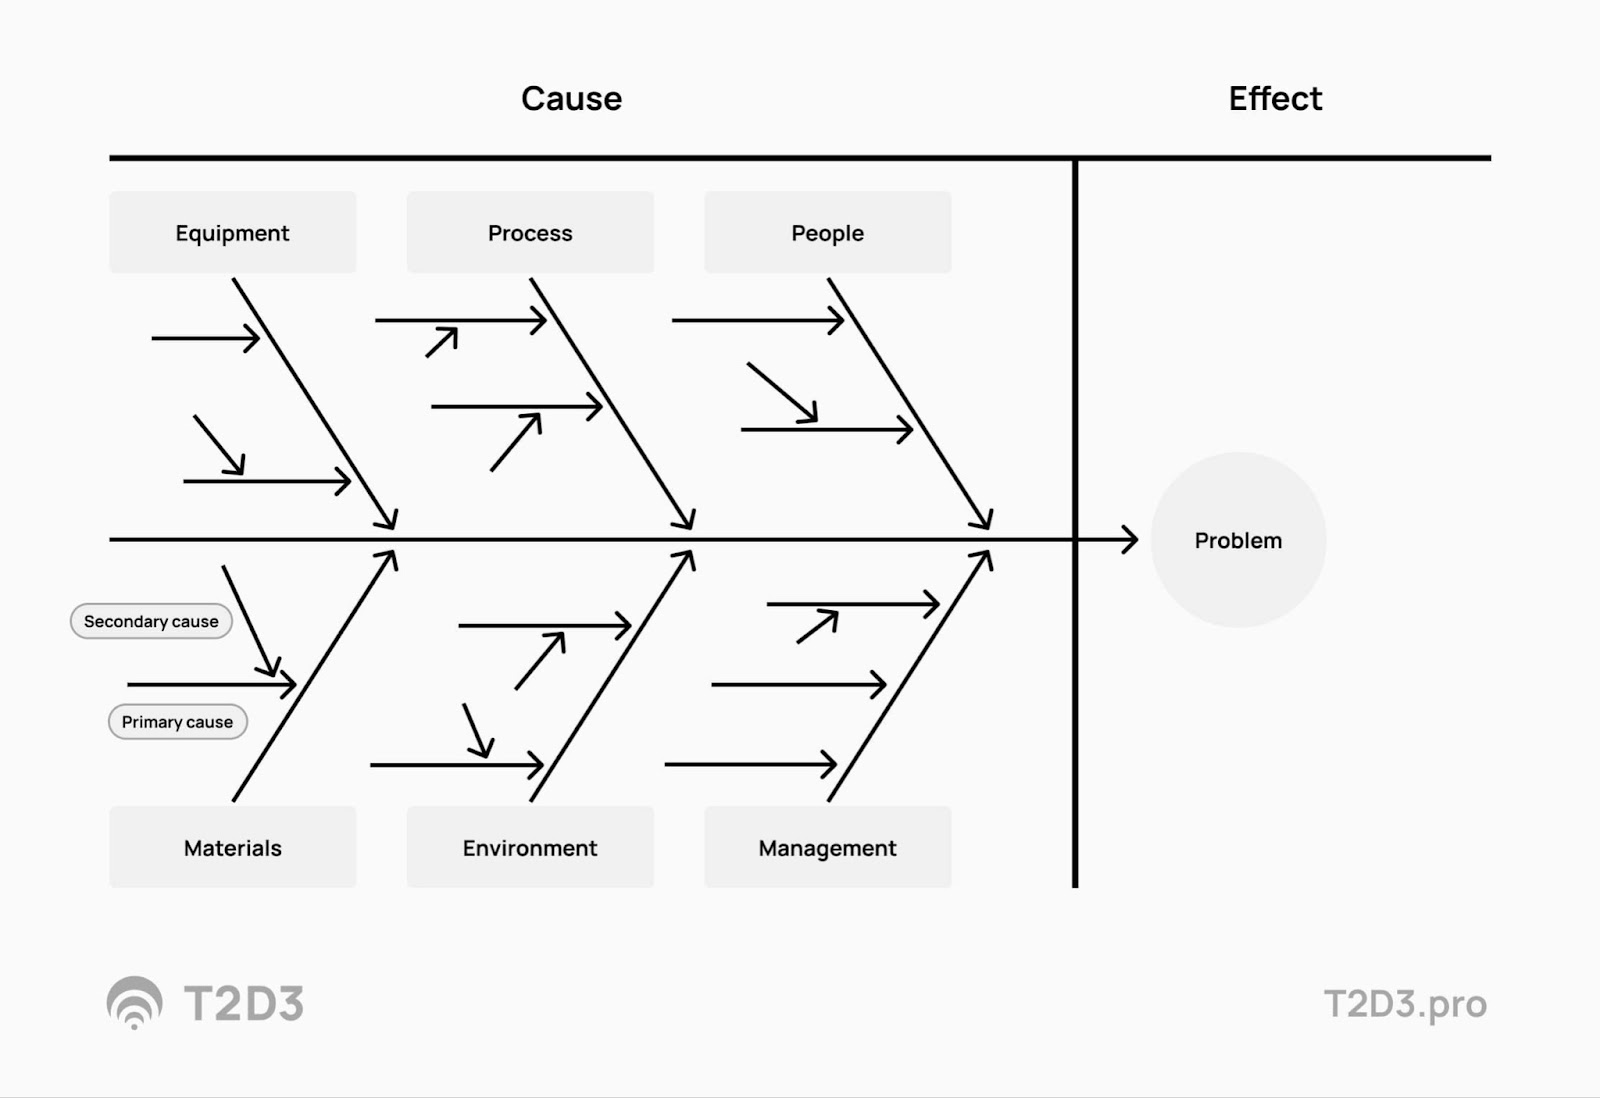
Here is an example of what that could look like for an everyday example, vs. addressing Marketing, Sales, or Customer Success performance.
|
Example
|
Marketing, Sales, and Customer Success scenarios.
|
|
We have a puddle of water in the basement
|
Revenue bookings are falling behind.
|
|
Why?
|
Why?
|
|
It seems the pipe is leaking.
|
- We are not getting enough opportunities in the funnel.
- We are not getting big enough opportunities in the funnel.
- We are getting opportunities in the funnel that don’t convert to wins.
- We convert opportunities to wins, but they never get onboarded and hence don’t pay and stay.
|
|
Why?
|
Why?
|
|
The pipe fitting is not sealing properly.
|
- We are not getting enough leads that convert to opportunities.
- We are getting the wrong leads that convert to opportunities.
- The opportunities are perfect, but the deal size ends up being too small.
- Our team is not trained/equiped to properly sell to the leads we get that turn into opportunities.
- Our team does not have the capacity to onboard new customers at the right speed and quality.
- The sales team sells things our product cannot do.
|
|
Why?
|
|
|
The pipes are corroding.
|
- The demand generation Marketing is driving is not working.
- The demand generation is focused on the wrong ICP.
- The deal size is small because we end up providing a high discount given competitive pressure.
- The deal size is small because our products are priced too low.
- The quality of the training is not good enough.
- The training has not happened.
- The sales materials are below par.
- The team does not have time to customize the materials to the proper prospect's needs.
- The CS team has the capacity, but the team is not yet trained to deal with the onboarding volume.
- The CS team is trained but is not staffed correctly to deal with the onboarding volume.
- The sales team is not clear on what they can sell, and what not.
- The sales team is selling the right thing, but executives come in and sell more than we can deliver.
- Our product is described to do things that it can’t.
|
|
Why?
|
Why?
|
- The wrong material was used.
- The pipes are 30 years old.
- The pipes were installed wrong without proper anti-corrosion treatment.
|
Etc. etc. etc.
|
|
Why?
|
- The pipes were installed by an unqualified installer. Let’s get this one fixed.
- The pipes were installed a long time ago, and we probably should consider replacing others in the house.
|
As you can see, there can be a lot of root causes, or combinations, that lead to outcomes falling behind. It’s very powerful to keep asking “Why?” until you have a list of root causes that can be ranked and turned into clear action items with follow-up owners.
I recommend a team leader does at least one A3 Problem solving “project” with their team each month. Get the facts, and solve the right problem by addressing its root cause with the proper follow-up and ownership.
How to run a Quarterly Business Review
First, don’t confuse an internal QBR with a QBR done with your customers by your Customer Success team or Executives. This article describes those, and here is a version for Sales. These are different from doing an Internal QBR, though.
The objective of an internal QBR is to stay aligned across all organizational functions on the following three questions:
Question #1: What happened?
- While last quarter’s performance is still fresh, team leaders should deliver a clear review of what actually happened and how this related to the original plan for the quarter. If your team uses OKRs, those can be a great framework for the content of the QBR.
- Ideally, the presentation is not just sharing data but turning those into specific insights, ideally with cause-and-effect understandings where possible. Where did we do better than expected, and why? In areas where we missed a plan, consider what we could have done differently — and when — to turn around losses.
- The focus should be on thinking and providing clear takeaways, not elaborate presentations that show how busy the team was.
- Usually, many people in the room have opinions about what happened in other people’s teams. Ask everyone to share the questions they would like to hear about before the meeting. Don’t allow people to throw curve balls just to look like the smartest person in the room (especially in front of other managers and executives). Your team leaders need to be able to provide confidence in their plans, and they need confidence that you’ve got their back.
Question #2: Are we on track?
- While question #1 will always uncover things that can be done better, you can still be in great shape. You need to be aware if you’re not, though. Executive credibility starts with acknowledging areas of pain that need to be addressed and not swept under a rug or postponed to be dealt with later.
- Since the QBR meeting might not be the best forum to get into detailed action planning, any areas that need to be addressed should be confirmed as a clear action item with a clear owner. Consider the A3 Problem Solving approach, as mentioned in the monthly meeting section, as a tool.
- It goes without saying that having a QBR does not mean a team should wait to address key performance issues till the QBR comes around. The monthly meetings should also uncover anything that needs urgent attention.
Question #3: How can we improve?
The QBR should inform what you can do in the next Quarter with the insights, opportunities, and challenges uncovered. Managers need to decide what guidance to give to their teams based on the QBR discussion.
Some QBR insights will make a team leader or company rethink the objectives they should focus on (for example, focus on market share vs. winning the top 10 largest prospects) or, more commonly, what the right target is to aim for in the next quarter, based on the previous quarter performance (great input for Key Results as part of the OKRs). This McKinsey Article does a nice job of describing the way QBRs, OKRs, and budgeting can be combined as one management toolset.
Who’s in the room?
Some companies invite all employees to participate in QBRs as the audience, and some keep it small for just the executive leadership team. Your culture and company values will inform this. I recommend not including too many people, though, when you are just getting started with running OKRs, as the “sausage making” to dial in this as an effective management tool could be a waste of time for people who are not directly contributing. Of course, each functional area of a company should participate and prepare and present their part of the review.
How to prepare?
1. Have great data
- The owner of the QBR topic owns the data. If you use a Bowler, you know exactly who owns what KPI and should have the highest quality data.
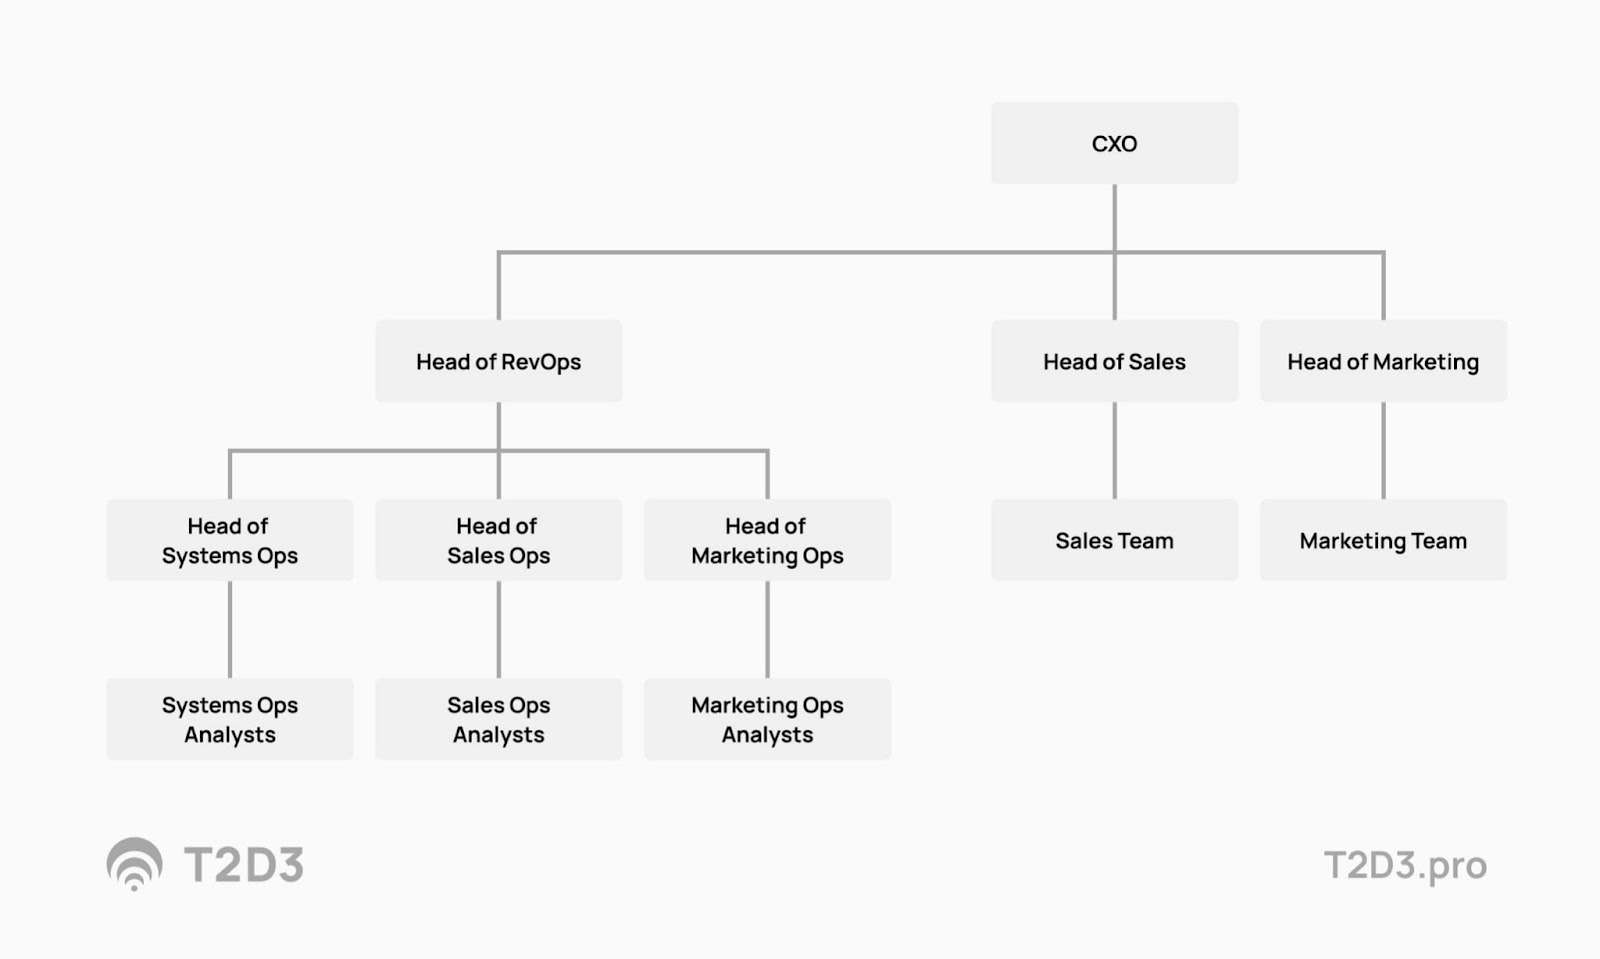
- As your company reaches a certain size (typically $10M+ ARR), consider centralizing your GTM data work into a single team, often called “RevOps”. This combines the responsibilities of Marketing and Sales CRM, financial information, Customer Success funnel data, sales operations, etc., into one team that has the ability to provide holistic analysis and high-quality data and keep your systems clean. When you are not ready to build your in-house RevOps team, companies like Kicksaw.
2. Use the previous quarter's OKRs.
- Consider using the OKRs that were set in the previous quarter as the foundation for the QBR. Those were basically the priorities that you set and how they landed in your team as the Quarter’s execution plan.
- Any discrepancies between OKRs and what actually happened can be used to make next quarter’s OKRs better and, of course, reflect on what happened in turning the previous quarter’s plan into what the team ended up focussing on.
3. Collect questions before the meeting.
- Ideally, you distribute the materials before the QBR and ask participants to share their questions before as well.
- I also encourage participants to come up with ideas on how they can help their peers from their functional areas.
How to behave
Sales should talk about Opportunities, Marketing about MQLs, and R&D about resolved product issues. This is not just because the owner (should) know their data best; it’s also because they are the owner for a reason. Owners should also focus on their own functions first. While Sales can show their pipeline is weak, their first point should not be to pull MQL data and try to make it a marketing conversation. They should first talk about the things they control to increase the number of opportunities (do their own prospecting, make sure leads are followed up fast, and provide insightful feedback to provide to marketing based on qualifying leads). If teams have dependencies on other teams that are partly explaining shortfalls, it’s also critical that the QBR is not the first time this is shared. The same for Marketing, which should not use the QBR to point out that leads are not being followed up. This is not a “smartest person in the room” contest, and all this data should already be uncovered in weekly on monthly meetings.
Rehearsal of your board meeting
The QBR can be great preparation, and maybe even a rehearsal, for your board meeting. The bowler and other materials that you use can save you time preparing your board deck and help make simpler versions of presenting the data, like the below example.
In this podcast, I cover the three marketing slides to always bring to the meeting and the questions you should always be prepared to answer. Finally, here are a couple more QBR best practices and a specific article to help prepare a Marketing QBR section.
How to build your annual plan
While building your annual plan goes beyond the scope of this article, there are a couple of things I like to review and then “lock” for, ideally, a year of execution.
- The Ideal Customer Profile (ICP) needs to be the foundation of many companies that want to scale, and confirming that annually has proven helpful for me.
- Based on the ICP, a company’s Positioning (and subsequent messaging) should also be relatively stable, at least for a year. With the market changing, competition making moves, and your customers providing you feedback, an annual review is warranted.
- I referred to the Growth matrix earlier, an exercise that I like to do at least annually to confirm the right Go-to-Market strategy based on the proper growth level assumptions.
- The Financial Plan, OPEX Budget (people and non-people), and Sales targets are of course, part of the annual planning as well. The Marketing budget should be set annually but can be adjusted based on ongoing insights, usually from Quarterly insights.
Acronyms and jargon used in this article
- ARR or MRR: “Monthly recurring revenue” or “annual recurring revenue”). This is the single most important metric for a SaaS business and summarizes the predictable revenue generated by our customers each month or each year through their subscriptions.
- Units: The unit is whatever pricing model your SaaS Business is based on. The most common unit is “users.” Examples are subscribers, devices, licenses, storage- or volume units (GB, Mbps, Processing volume), people, seats, and sensors. This depends on how your pricing model connects with how your solution drives value.
- Customer Logo: The use of new or existing ‘logos’ in SaaS Business talk is a reference to putting the logos of your clients on your web pages or marketing and sales content. Logos help drive credibility and reputation. When discussing business performance, "New logos" is the opposite of "existing customers" and usually also is used to differentiate between winning a “top-level” new business brand vs. a subsidiary or departmental win. When referring to churn in SaaS, there is often a distinction between losing revenue (revenue churn) and actual customer accounts (logo churn). Since landing new and retaining existing “logos” is essential for a SaaS business, in addition to revenue growth and retention, this term has become popular to emphasize this nuance.
- User penetration: Amount of users (or units) used within a single customer account.
- ARPU: Average Revenue Per Unit is an indicator of the profitability of a product based on the amount of money generated from each of its users or subscribers. It is a particularly useful measurement for companies in the telecommunications and media industries, which rely on subscribers or users, and fundamental for SaaS companies. ARPU is usually calculated as total revenue divided by the number of units, users, or subscribers. Sometimes the “A” in ARPU gets confused for it being an Annual metric. ARPU can be measured by any time period, though (i.e., per week, per month, per year)
- Advocacy: Customer users providing positive recommendations to others who are not using your solution yet.
- Referrals: Units (usually users) that became customers after being referred by existing users from customers or partners through advocacy.
- Renewals: In SaaS, a renewal refers to the subscription part of the SaaS business that can be renewed on not renewed. The latter can be an active action (canceling the subscription) or a subscription expiration at the end of its term. When a subscription needs to be renewed through action by the user or customer or is renewed automatically based on the subscription terms, this is called a renewal.
- Churn: When SaaS customers don’t renew their subscription or actively cancel their subscription, this is called churn. Churn is one of the critical metrics to understand a SaaS Business Performance and is sometimes split up into “logo churn” (losing named customers) and “revenue churn” (the financial impact of churned customers).
- Downsell: When a customer declines an initial offer, in most commerce transactions, the term down-sell describes your attempt to sell them something at a lower price point to convert the prospect into a sale. In SaaS, however, the term “down-sell” is often used together with MRR (Downsell MRR) to describe any downgrades or canceled services by existing customers that lead to Monthly Recurring Revenue going down.
- X-sell: Related to down-selling is "cross-selling.”, sometimes also called “up-selling.”. This describes offering related features, products, or solutions to the service that was initially acquired. Cross-selling is a good indicator for the customer- and user loyalty.
- Feature usage and usage frequency: Usage metrics help measure the level of engagement by users with your product or solution. It’s a good indicator of the amount of value an individual user gets from using your capabilities. Increased usage frequency or increased use of the number of features is often a good indicator of increased future loyalty and can support longer-term price increases if the user also finds the value accrued from using the product greater. When usage metrics go down, this often is a trigger to expect potential user churn.
- Win rate: Conversion of qualified sales opportunities to paying customers.
- ASP: In many industries, the term Average Sales Price or Average Selling Price is used to set a benchmark for the desired pricepoint. In SaaS, it’s usually the actual calculated average of the initial price at which new customers buy the SaaS solution and does not include upsell that happens later in the customer relationship.
- MQL: From Mike Northfield’s article How do you define a SaaS MQL (for B2B companies)? (kalungi.com), “An MQL is a lead that the marketing team has qualified as having demonstrated intent/interest in your product (based on a set of mutually agreed-upon criteria) and is ready for handoff to the sales team.”